Common Name: Mink – Northern European origin, possibly from Swedish menk, which meant “stinking animal from Finland.“ It became mynk in Middle English and linguistically crossed the Atlantic to become mink in American English.
Scientific Name: Neogale vison – The genus is a recently introduced taxonomy that distinguishes American mink from European mink. The Greek word for weasel is galē so the new genus is essentially “New World weasel.” Vison, sometimes vison weasel, is another name for American mink, though rarely used. Weasel is derived from wisula, Old High German for weasel, translating to vison in French. In older texts, Mustela vison is used, the genus a derivative of Mustelidae. Musēla is Latin for weasel.
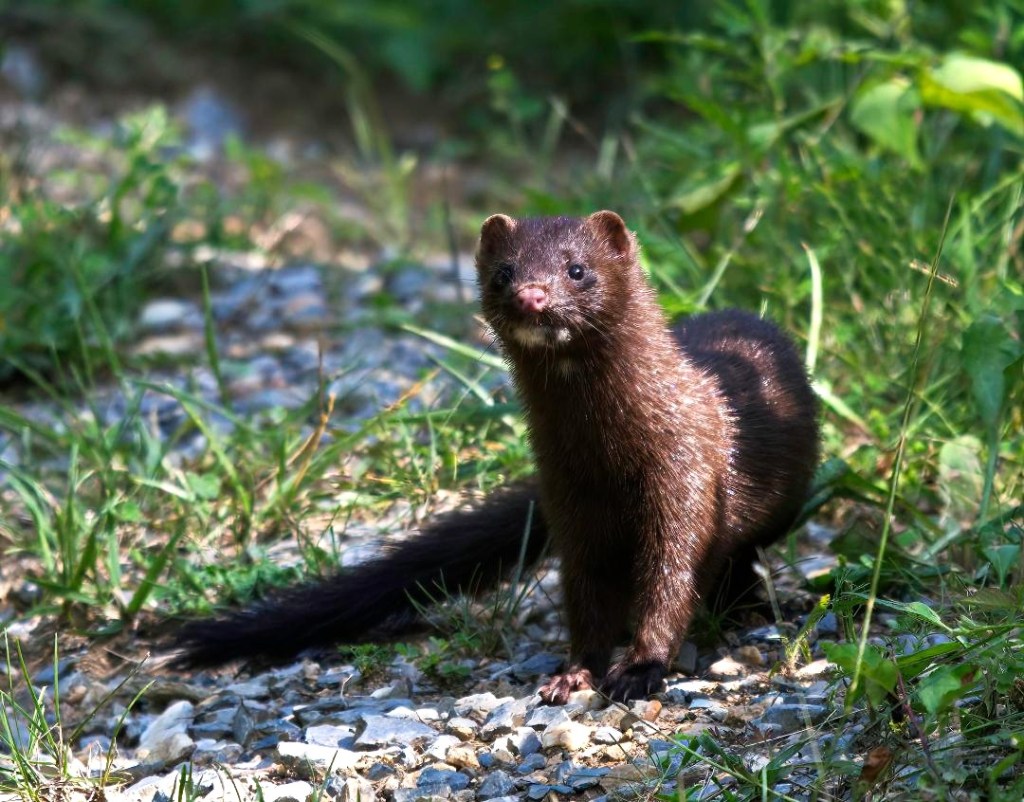
Potpourri: The furtive mink is rarely seen on wooded trails away from water as they are predominantly aquatic predators. The photo above was taken at Lilypons, a nursery near Frederick, Maryland specializing in water lilies and other aquatic plants that closed in 2025 after a hundred years of operation. The many ponds there offered an ideal and protected habitat with ample food that apparently led to a degree of familiarity due to the frequency of human encounters. Like its cousin the otter, minks are protected against the penetrating cold water by a dense, layered coat of fur. The soft and dense undercoat fur is called ground hair and the longer protective covering is called guard hair. [1] Because of this superior natural insulation, similar to that of the beaver, it has been subject to human predation for centuries. Because it is killed for its luxurious pelt and not eaten as meat, it is the iconic symbol of animal rights activists just as much as the polar bear is to those concerned about global warming.
Minks evolved to take advantage of the opportunity afforded by riparian habitats with superior swimming abilities, including partially webbed feet, and a waterproof pelt. Primarily carnivorous minks subsist on other animals that congregate in and around water. While its preferred prey is muskrat, minks also consume fish, amphibians, snakes, and marsh-dwelling birds as alternatives. Absent the availability of animals for meat, berries, eggs, and even carrion may be consumed, testimony to the survival skills afforded by adaptability. Water also provides an escape route from mink predators such as lynx, fox, and coyotes, which are not as adept in water. Minks can hold their breath, remaining submerged for over a minute, and dive as deep as sixteen feet while moving rapidly away under water. Beaver followed a similar evolutionary path along and in streams as swimming and lodging herbivore rodents. [2]
Like most mammals, the life cycle of the mink is concentrated on successful procreation. Roving males establish territories that extend over larger streams that normally encompass several female territories in smaller, tributary streams. Both males and females establish and maintain territorial boundaries with malodorous discharges for anal glands that are similar but not as penetrating as those of closely related skunks. Called sexual habitat segregation, it is an evolved behavioral pattern that limits intersexual competition. [3] Males copulate with several females within their boundaries in winter and eventually cohabit with one. Egg uterine implantation is delayed by females for up to six weeks depending on the temperature to ensure birth of 3 to 7 young called kits born blind and naked in early spring. Males play no role in parenting, consistent with typical mammal behavior. Dens serve as a palladium from the elements for both male and female minks. While repurposed muskrat burrows or beaver dens suffice, new dens may be dug out near a stream bank if necessary.
Minks are members of the Family Mustelidae, the largest group in the Order Carnivora, with about 85 extant species in 33 genera worldwide that evolved from about 400 extinct species. Carnivores are either dog-like, including bears, raccoons and the pinniped seals and walruses in addition to mustelids or cat-like, which includes mongooses and hyenas. Mustelids provide an exceptional example of adaptive radiation, the evolution of traits and appearance that are necessary and sufficient to survive in different habitats as individuals relocate to new areas. The ancestral mustelid first appeared in Eurasia in the Oligocene Epoch about 30 million years ago and dispersed globally. Body length became the most notable morphological discriminant. [4] The modern mink first appears in the Pleistocene, about 3 million years ago, evolving separately in both North America (E. vison) and in Eurasia (Mustela lutreola, lutra is Latin for otter). In the modern era, American minks have been introduced to Europe where they outcompete the local minks due to better adaptability to new habitats. [5]
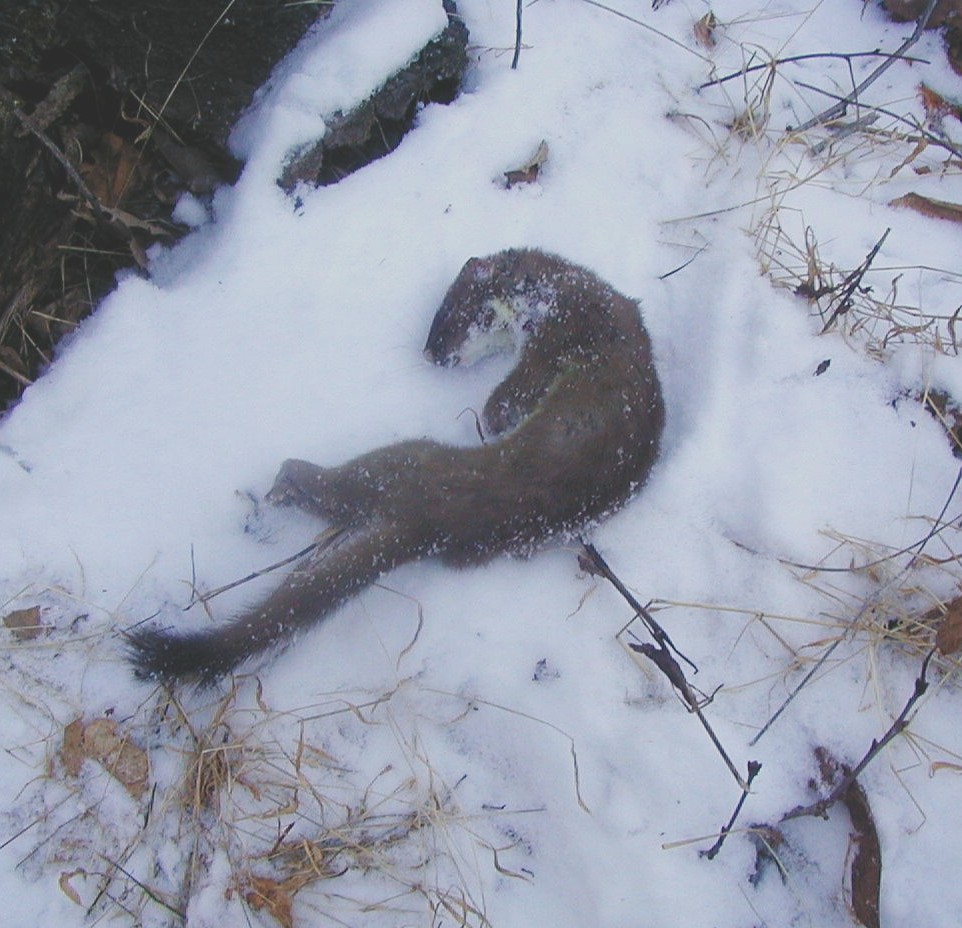
Where minks are furtive and few, weasels, the namesake of the Mustelidae, are the most common carnivore in the Western Hemisphere. Weasels employ the characteristic mustelid scent for territory markings and breeding behaviors are almost identical to those of the mink. One major difference between weasels and minks is habitat and prey. Where minks are aquatic and prey on animals in or near water, weasels are terrestrial, preying mostly on rodents like voles and chipmunks. The challenge of chasing rodents gave rise to the weasel’s sinuous, bounding attack. They are noted for killing spree assaults on hen houses. The weasel’s reputation for stealth and deception are captured in the dictionary definition as “a sly, cunning, or sneaky person.” Weasel words connote lack of commitment. Weasel fur, while protective, is not as dense and protective as that of the mink. In winter, the dearth of terrestrial prey and limited heat insulation takes its toll.
Food, clothing, and shelter are the three fundamental physiological needs on which Maslow’s hierarchy rests. Animals provide two of them. When the first hominids ventured out into Africa’s savannahs, they left behind the food of fruited forests and became naked apes. As Homo sapiens evolved and migrated north into Eurasia, animals as a source of warm clothing became just as important as food. Bone tools were found at an archeological dig in Morocco several years ago that are thought to have been used for sewing animal skins together about 100,000 years ago. [6] This was coincidentally the beginning of the last Ice Age. While the domestication and slaughter of animals for food has been grudgingly accepted today as normative, notwithstanding vegan preferences and greenhouse gas issues, the killing of animals for clothing faces widespread disapprobation. Mink is at the epicenter of this cultural controversy.
The animals as food debate has been integral to the development of Western Civilization ever since it entered the modern age in the 16th century (Gutenberg’s printing press first appeared in the mid-15th century giving rise to the spread of books like the Bible). The Catholic Middle Ages relied on the Bible as divine and irrefutable law. In Genesis, man is instructed to “be fruitful and multiply” and “have dominion … over every living thing that moveth upon the earth.” This was nothing new, as even Aristotle, the fount of Greco-Roman culture offered that “plants are created for the sake of animals, and animals for the sake of men.” While there are good philosophical arguments about not eating animals, there are none that stand up to the practical reality of survival in a world of scarcity. As Thomas Huxley, widely known as Darwin’s bulldog (in championing the theory of evolution), observed, civilization is a conspiracy against nature. [7]
There is a somewhat more nuanced argument about skinning animals and not eating them. Cow skin is collected as a byproduct of the abattoir and tanned into leather for everything from shoes to saddles with little objection. Animal fur has been used for clothing in the northern reaches of Eurasia for millennia. Survival in the frigid expanse of the boreal forest and open tundra required ingenuity in the use of fire, skill in hunting animals for food, and staying warm enough to procreate in caves and chase after prey, especially in winter. The choice of clothing mattered and warmer furs were more protective. Evolution to the environment is the driving force of survival of the fittest. Animals like minks that established niche habitats of frigid waters can only have done so with random mutations that perfected the fur coat. Humans merely repurposed them. Presumably, a better “suited” hominid could have evolved so as to retain and improve on body hair for warmth and endurance. However, evolution has only a historical past but has no plan for the future and hunting with animal skin clothing was more successful than being hairy for evolutionary survival.
Fur trapping and trading was integral to the colonization of North America. New France was reliant on the fur trade established by royal decree. The Hurons of the Great Lakes region supplied the pelts of mostly beaver and otter from the interior first to French entrepôts first at Quebec City and later at Montreal for export back to Europe. Later, coureurs du bois (French for wood runners) penetrated ever westward in their efforts to trap fur-bearing animals for skins to fill the insatiable demand of Europeans, who had depleted their native wildlife populations over centuries of exploitation. John Jacob Astor created the first American trust with the American Fur Company in the early 19th century, extending it westward as the Pacific Fur Company with an outpost on the Columbia River named Astoria in 1805. Top hats made from beaver skins became the symbol of the Victorian Era. [8] It could be convincingly argued that fur trapping and trading was foundational to the establishment of the United States as a leading world economic power.
That was then. The world has since become overrun by habitats for humanity at the expense of habitats for animals. The plight of the mink has been particularly harsh, as its fur is the most popular in the world, with about 80 percent coming from mink farms and 20 percent from trapping animals in the wild. Fur has been popular in fashion since the 10th century. Even the Vikings considered American beaver pelts as exotic. High demand followed population and prosperity through the post World War II consumer era to peak in the 1980’s with a global trade value of almost two billion dollars. The mink stole was the height of fashion. As the environmental movement arose to address polluted air, spoiled water, and plunging wild animal populations, the fur industry became an inevitable target. From a peak of almost 4,000 mink farms in the United States in the 1940’s, the number has plunged to about 100 in 2021. [9]
Faux fur was introduced in the early 20th century using looped yarn, a process pioneered for making velvet and corduroy. Technology advances led to the use of silk and then polymers like Orlon replicating the appearance, but not the feel, of real mink in the 1950’s. The textile industry began supporting anti-fur ads in the 1970’s with celebrities such as Doris Day pronouncing, “killing an animal to make a coat is a sin.” [10] As fashion follows a sinusoidal trajectory according to capricious human nature, real fur is in the midst of a renaissance. The increase in the super rich population seeking to distinguish their relative prosperity drives the popularity of things like Maserati Automobiles and Patek Philippe watches―and real mink fur coats. As expense is all that matters, the preference is for wild mink fur as opposed to minks raised on farms since it is more natural, but mostly because they are more expensive. There is also a practical side for real fur as an article of clothing for protection against the cold. The polar weather that periodically moves south makes it abundantly clear that nature’s insulation is worth another look. There will continue to be a demand for mink fur among certain demographic groups in spite of widespread opprobrium.
Trapping wild animals is a practice that should be discouraged. Even though regulations for trapping are intended to be safe and effective, including the requirement that each trap is to be inspected daily, it is almost impossible to enforce them without an army of government agents. An animal with one leg painfully clamped in a metal trap for days is one of the realities of trapping that should evoke the need for change. [11]

Mink farming offers a middle ground. Mink farmers do not profit by harming their livestock, which are domesticated animals like cows and pigs. All are eventually killed, skinned, and exploited. While mink meat is rarely eaten by humans, it is rendered into a variety of products from pet food to organic fertilizer. Mink oil is valued as a source of hypoallergenic cosmetic products. [12] Protection of the environment and its animal denizens must involve some compromise to ever succeed in a burgeoning human population. Wild minks will proliferate, controlling muskrat populations, and maintaining the ecological balance of their habitats in spite of humans if mink farms provide an acceptable alternative.
References:
1. Gintel, O. “Furs” Encyclopedia Brittanica Macropedia Volume 7 pp 811-817, William Benton Publisher, University of Chicago 1972.
2. Whitaker, J. National Audubon Field Guide to North American Mammals, Alfred A. Knopf, New York, 1996. pp 754-787.
3. Zabala, J. et al (2007). “Spacing pattern, intersexual competition and niche segregation in American mink”. Annales Zoologici Fennici. Volume 44 Number 4 11 January 2007.
4. Law, C. et al. “Lineage Diversity and Size Disparity in Musteloidea: Testing Patterns of Adaptive Radiation Using Molecular and Fossil-Based Methods”. Systematic Biology. 1 January 2018Volume 67 Number 1 pp 127–144
6. Hallett, E. et al “A worked bone assemblage from 120,000–90,000 year old deposits at Contrebandiers Cave, Atlantic Coast, Morocco” iScience, Volume 24, Issue 9, 24 September 2021. https://www.sciencedirect.com/science/article/pii/S2589004221009561
7. Stuart, T. The Bloodless Revolution, W, W, Norton, New York, 2006, a detailed account about the history of vegetarianism from 1600 to today.
8. DeVoto, B. The Course of Empire, Easton Press, Norwalk Connecticut, 1952, pp 97,140, 539.
9. https://www.britannica.com/procon/fur-clothing-bans-debate
10. Hines, A. “The History of Faux Fur” Smithsonian Magazine, 22 January 2015. https://www.smithsonianmag.com/history/history-faux-fur-180953984/
11. US Fish and Wildlife Service https://www.fws.gov/story/trapping
12. Fur Commission “Mink Farming in the United States” November 2002 http://www.furcommission.com/resource/Resources/MFIUS.pdf